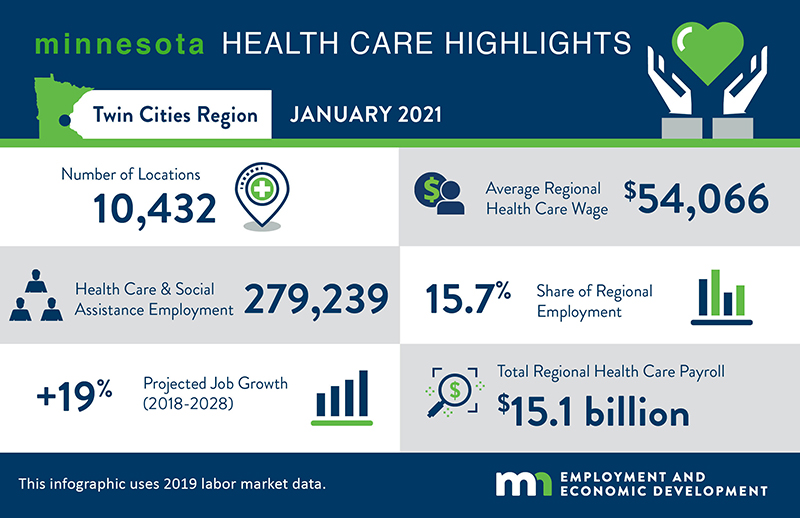
Health Care and Social Assistance is, far and away, the Seven-County Metro Area’s largest-employing industry sector. As seen in the infographic, the industry had nearly 280,000 jobs in the region in 2019, accounting for more than one in every seven jobs in the region. In fact, it had over 100,000 more jobs than the region’s second largest-employing industry, Manufacturing. Between 2010 and 2019, Health Care and Social Assistance employment grew at a rate twice that of the whole economy, adding nearly 63,000 jobs. This accounted for over one-quarter of total jobs added in the Metro Area over that period.
Like every other industry sector, however, Health Care and Social Assistance experienced employment losses in 2020. Between the second quarters of 2019 and 2020 Health Care and Social Assistance employment in the Metro Area dropped by 8.3%, equivalent to just over 23,000 jobs (Table 1). Employment losses during that period were most pronounced in:
- Offices of Physicians: -4,342 jobs (-13.1%)
- Offices of Dentists: -3,626 jobs (-35.5%)
- Child Day Care Services: -3,364 jobs (-27.4%)
- Vocational Rehabilitation Services: -3,001 jobs (-45.2%)
- General Medical and Surgical Hospitals: -2,834 jobs (-4.3%)
- Offices of Other Health Practitioners: -1,995 jobs (-17.6%)
- Nursing Care Facilities (Skilled Nursing Facilities): -1,311 jobs (-6.9%)
Table 1: Health Care and Social Assistance Employment in the Seven-County Metro Area, Q2-2020
| Industry | Number of Establishments | Number of Jobs | >Avg. Annual Wage | Q2 2019 – Q2 2020 Job Change | |
| Numeric | Percent | ||||
| Total, All Industries | 87,574 | 1,547,548 | $69,264 | -236,862 | -13.3% |
| Health Care and Social Assistance | 11,620 | 255,781 | $53,248 | -23,023 | -8.3% |
| Ambulatory Health Care Services | 4,586 | 76,236 | $66,820 | -11,526 | -13.1% |
| Hospitals | 90 | 65,090 | $71,604 | -3,091 | -4.5% |
| Social Assistance | 5,479 | 63,990 | $30,576 | -6,442 | -9.1% |
| Nursing and Residential Care Facilities | 1,465 | 50,464 | $37,752 | -1,964 | -3.7% |
| Source: DEED Quarterly Census of Employment and Wages | |||||
According to DEED’s Current Employment Statistics (CES) monthly data, Health Care and Social Assistance employment in the 16-county Minneapolis-St. Paul Metropolitan Statistical Area (MSA) did rebound through November. More specifically, the industry added 19,827 jobs (+7.6%) between April and November in the Minneapolis-St. Paul metro area which covers more counties than those in the seven-county metro area. That means the larger metropolitan area regained about two-thirds of the 29,497 Health Care and Social Assistance jobs lost between February and April. This rebounding of Health Care and Social Assistance employment in the Seven-County Metro Area will likely be reflected in third quarter data when released.
It should also be noted that continued claims for Unemployment Insurance (UI) by Metro Area Health Care and Social Assistance workers spiked at 36,674 in May. This was 2,810% higher than such claims made one year previous. Continued UI claims for such workers dropped to 6,602 during the week of December 5th. While down significantly from May, this was still up about 450% from one year previous.

For More Information
Contact Tim O’Neill, Labor Market Analyst.
To find out more the health care industry, including current employment opportunities, visit www.careerforcemn.com/industry/health-care.


